Managing Memory - 🏎️
When building applications, some performance measures you should be concerned with, especially when getting your application production ready, are speed and memory. This is popularly referred to as time and space in programming. In this post, a cool module that can be used to track memory usage and eventually debug memory leaks, bottlenecks, data structures that could be changed or optimized and therfore manage memory resources efficiently in python is demonstrated.
We will talk about the tracemalloc module and monitoring tools like Grafana, AWS CloudWatch.
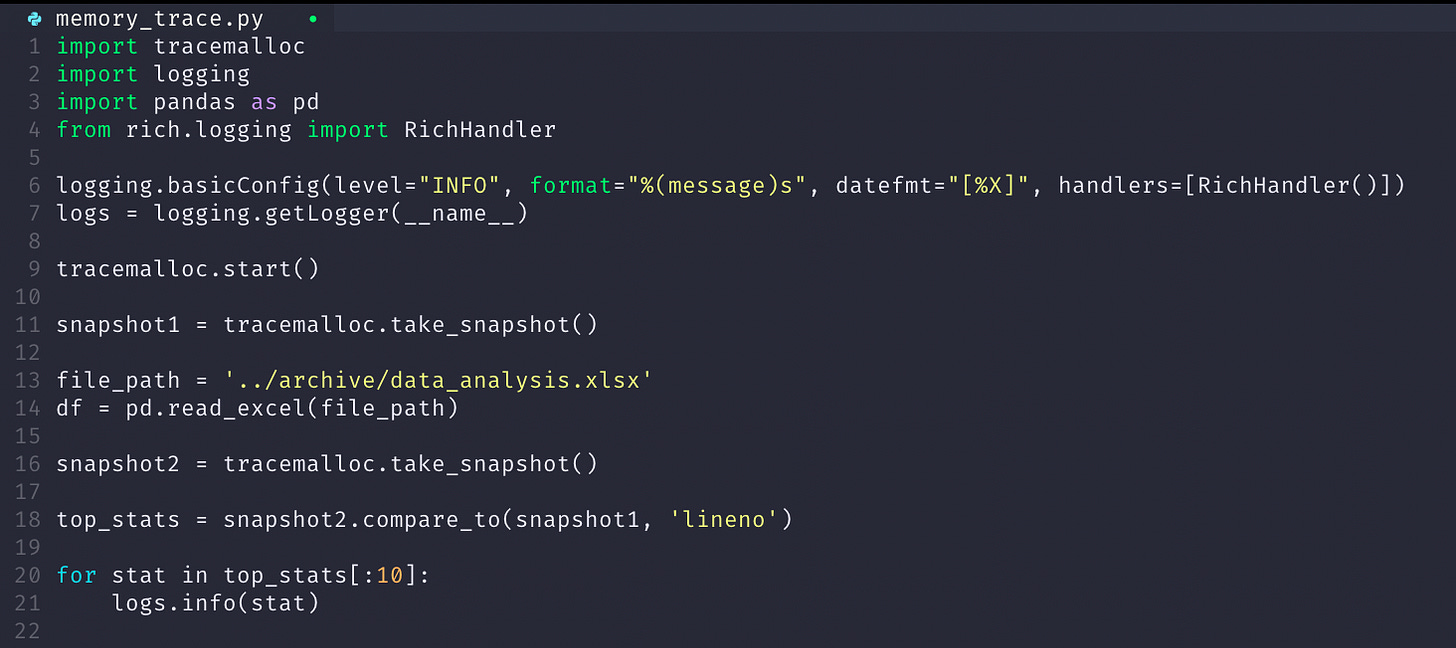
The code above simply loads an excel sheet into a pandas dataframe using the Pandas and Openpyxl libraries. It takes a snapshot of the memory before and after the dataframe load and logs out the top ten memory usage stats. The topmost stat from the logs is shown here:
INFO /Users/…/.venv/lib/python3.12/site-packages/pandas/io/excel/_openpyxl.py:61 memory_trace.py:21
6: size=3045 KiB (+3045 KiB), count=19987 (+19987), average=156 B ::
We see that the Openpyxl library currently makes use of the most memory (3045 Kilobytes), which is quite insignificant in the large scheme of things. However this can still be optimised. In a large code base, there is likely to be a process taking much greater memory.
Tracemalloc is a python module that helps to traceback where an object was allocated, get statistics on allocated memory blocks and compute the differences between snapshots to obtain memory use and detect memory leaks.
To track memory usage of applications in production, you can make use of tools like:
AWS CloudWatch: For applications hosted on AWS, CloudWatch can be used to monitor momory usage and set up alarms for thresholds.
Prometheus and Grafana: These tools used together can help pull and visualisze memory usage metrics over time.
Best Practices to Follow
For adhoc cases, you can run the “top” command on your terminal to see how much a running python program or any process is taking. If the memory keeps increasing, there is likely a memory leak somewhere. Best practices for managing memory usage includes:
Code Reviews and Static Analysis: Perform regular code reviews using static analysis tools to identify memory management issues early.
Garbage Collection Tuning: Configuring and tuning the garbage collector can help manage memory more efficiently.
Testing: Implementing stress tests and load tests can help identify memory issues under high load conditions.
The aim is to bring to your consciousness these concepts and related tools, so you can refer to them later during your programming journey, prevent memory leaks and optimize memory usage in production.


